External Trade
Hong Kong's external trade had another year of
impressive performance in 2004. Apart from buoyant global and regional
demand, continued weakness of the US dollar rendered a further boost
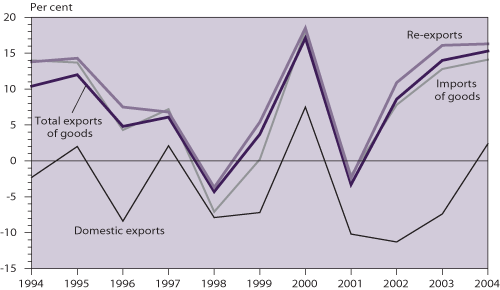
to Hong Kong's external competitiveness. Total exports of goods
(comprising re-exports and domestic exports) leaped by 15.3 per
cent in real terms in 2004, up even further from the already strong
growth of 14 per cent in 2003. There were double-digit increases
in all four quarters of the year, and by the fourth quarter of 2004,
total exports had sustained double-digit growth for five straight
quarters. On a seasonally adjusted quarter-to-quarter comparison,
total exports of goods rose strongly during the first two quarters
of 2004, settled back somewhat in the third quarter, before bouncing
back strongly in the fourth quarter.
Re-exports continued to outperform overall export
growth, surging by a further 16.3 per cent in 2004, following 16.1
per cent increase in 2003. Benefitting from the Mainland's buoyant
trade flows in the year, and also reflecting Hong Kong's prominent
role as the trade conduit between the Mainland and the rest of the
world, Hong Kong's re-export trade involving the Mainland was robust
throughout 2004.
Despite the continuing drag from the structural
shift to re-exports and offshore trade, domestic exports bounced
up to a modest 2.4 per cent increase in 2004, the first growth since
2000. The growth was most remarkable in the fourth quarter due to
a significant rebound in exports to the Mainland, possibly as the
boost from CEPA progressively showed up.
In 2004, the Mainland and the United States were
the two largest markets for Hong Kong's total exports (including
domestic exports and re-exports), accounting for 44 per cent and
17 per cent respectively of the total. Other major markets included
Japan (5 per cent), the United Kingdom (3 per cent), Germany (3
per cent), Taiwan (2 per cent), the Republic of Korea (2 per cent),
and Singapore (2 per cent).
Mirroring closely the expansion in re-export trade,
and also with a notable growth in import intake for local use, imports
of goods likewise flourished, surging by 14.1 per cent in real terms
in 2004. Imports of goods sourced from East Asian markets performed
particularly well, with imports from the Mainland — the largest
source of Hong Kong's imports — attained an even more marked
growth in 2004. Within total imports of goods, retained imports
of capital goods, particularly industrial machinery for manufacturing
use, and telecommunications equipment, picked up visibly in 2004,
as investment sentiment turned more sanguine and as the more established
economic recovery necessitated further expansion in productive capacity
to meet increased demand (Chart 7).
| Chart 7 |
| Hong Kong's visible trade |
| (year-on-year rate of change
in real terms) |
 |
With the increase in value of imports of goods
exceeding that of total exports of goods, the visible trade deficit
reckoned on a GDP basis widened in absolute terms, to $72.5 billion
or 3.5 per cent of the value of imports of goods in 2004, from $45.0
billion or 2.5 per cent in 2003.
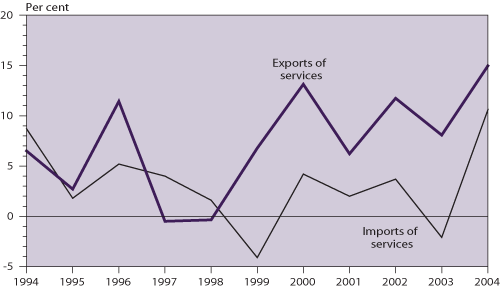
On invisible trade, exports of services sustained
strong growth momentum in 2004, with the setback caused by SARS
now well behind. For 2004 as a whole, there was a 15 per cent leap
in real terms, much faster than the 8.1 per cent increase in 2003.
The pick-up in exports of services was across-the-board, marked
by highly distinct growth throughout the four quarters of 2004.
The pace of the upturn was remarkable, even after allowing for the
distortion caused by SARS in the second quarter of 2003.
The robustness of exports of services in 2004 was
due in large part to the further surge in trade-related services,
the largest component within exports of services. The region-wide
trade boom, and more importantly, surging trade flows involving
the Mainland, underpinned the fast growth in offshore trade. Exports
of transportation services also picked up strongly, as passenger
services were buoyed by a strong influx of incoming visitors, while
cargo services thrived upon the lively external trade. Exports of
travel services rebounded strongly, with record-breaking numbers
of visitor arrivals during the year. Not only did the number of
visitors from the Mainland jump to a record-high in the year, those
from most other sources also surpassed the pre-SARS levels well
before the year-end. Meanwhile, exports of finance, business and
other services posted a notable growth along with the increase in
business activities.
Imports of services reverted to a substantial 10.7
per cent leap in real terms in 2004, after the setback caused by
SARS led to a 2.1 per cent decline in 2003. As with exports of services,
imports of services had a quarterly profile distorted by the SARS
outbreak in 2003, with a much magnified increase attained in the
second quarter of 2004 but still solid increases in the other three
quarters. Imports of travel services, the largest component within
imports of services, rose distinctly in 2004 after the plunge in
2003. Imports of transportation services also benefited from the
rebound in residents spending abroad, boosted further by a sharp
rise in incoming cargoes. Imports of trade-related services had
another year of distinct growth on the back of soaring offshore
trade. Imports of finance, business and other services also strengthened
amid the activity upturn.
As exports of services rose faster than imports
of services, the invisible trade surplus reckoned on a GDP basis
expanded further to $185 billion or 79.7 per cent of the value of
imports of services in 2004, from $153.4 billion or 76 per cent
in 2003. This more than offset the enlarged visible trade deficit
to yield a combined surplus of $112.5 billion in 2004, equivalent
to 4.8 per cent of the total value of imports of goods and services
in that year, as compared with $108.4 billion or 5.4 per cent in
2003 (Chart 8).
| Chart 8 |
| Hong Kong's invisible trade |
| (year-on-year rate of change
in real terms) |
 |
Domestic Demand
Local consumer spending maintained notable growth
throughout the year, as consumers' willingness to spend was well
underpinned by optimism over the economic outlook, improving labour
market conditions, and the wealth effect from the rebound in property
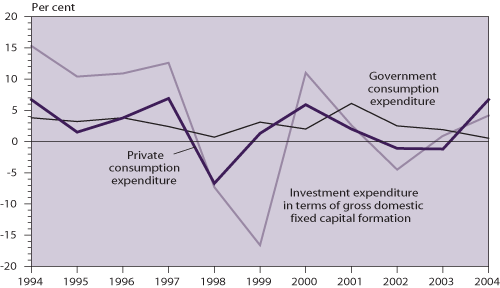
prices. Private consumption expenditure (PCE) grew by 5.7 per cent,
10.9 per cent, 5.3 per cent and 5.9 per cent respectively in real
terms in the four quarters over a year earlier, producing a 6.9
per cent growth for 2004, as a whole, the fastest since 1993. The
high growth in the second quarter was in part inflated by an exceptionally
low base caused by SARS in 2003. On a seasonally adjusted quarter-to-quarter
comparison, PCE grew by 1.0 per cent and 2.2 per cent in real terms
in the first and second quarters, eased back to 0.2 per cent increase
in the third quarter, and then picked up again to 2 per cent growth
in the fourth quarter.
Overall investment spending in terms of gross domestic
fixed capital formation attained 4.1 per cent growth in real terms
in 2004, the fastest since 2000, as the activity upturn and brighter
business outlook prompted a broad-based surge in machinery and equipment
investment to fuel business growth. Worth noting was that investment
in industrial machinery for manufacturing use, which has been on
a general fall-off in recent years, also rebounded significantly
in the year.
On the other hand, building and construction output
remained generally slack in 2004, with overall expenditure on building
and construction falling by 11.1 per cent in real terms in 2004,
following a 5.6 per cent decline in 2003. Expenditure on building
and construction in both the private and public sectors fell, by
13.7 per cent and 5.7 per cent respectively. While private sector
building activity was dampened by the earlier sluggishness in the
property market, public sector output was dragged down by the further
shrinkage in works under the Public Housing Programme and the completion
of several priority railway projects, including West Rail, the KCRC
East Rail extension to Tsim Sha Tsui and Ma On Shan Rail (Chart
9).
| Chart 9 |
| Main components of domestic
demand |
| (year-on-year rate of change
in real terms) |
 |
Net Output or Value Added by Economic Activity
As reflected in GDP by major economic sector at
constant prices, net output or value added for all the service sectors
taken together grew markedly by an average of 8.8 per cent in real
terms in 2004 over a year earlier, almost double the 4.5 per cent
gain in 2003. Sustained recovery in local consumer demand, robust
trade performance and vibrant inbound tourism were the major contributory
factors. Analysed by constituent sector and in real terms, net output
in transport, storage and communications rose most sharply, by 17
per cent in 2004, backed by a surge in merchandise trade flows amid
vibrant global demand and by a continued proliferation of the telecommunications
industry particularly of mobile phone and international telephone
services. Meanwhile, net output in the wholesale, retail and import/export
trades, restaurants and hotels also registered robust growth, at
13.3 per cent. Continued recovery in local consumer demand, remarkable
trade performance, and resurgence in inbound tourism all contributed.
Meanwhile, net output in finance, insurance, real estate and business
services recorded an 8 per cent increase, led mainly by the improved
performance of the banking sector. Fees and commission earned by
banks showed particularly strong growth, along with the rapid development
in various personal banking services and fund management. Net output
in community, social and personal services firmed up to 3.9 per
cent growth, with a particularly distinct rebound in recreation
and entertainment services, in line with better consumer sentiment
and improved labour market conditions.
For the manufacturing sector, under the support
of a highly favourable trading environment, net output posted a
2.9 per cent growth in real terms in 2004, as against a 9.1 per
cent drop in 2003. To promote wider use of design and innovation
in industries to help them move up the value chain, and ultimately
turn Hong Kong into a focal point of design excellence in the region,
the Government set up the DesignSmart Initiative in June 2004, which
includes a Design Support Programme and establishment of an Inno
Centre. As to the construction sector, overall construction activity
remained slack, with net output in this sector falling by 8.5 per
cent in 2004 after a 4.6 per cent decline in 2003. The fall-off
was the combined result of the completion of some prominent private
sector building projects, a further drop in output under the Public
Housing Programme, and the completion or winding down of railway
projects.
The Labour Market
The labour market improved progressively on a broad
front throughout 2004, as economic growth gathered momentum and
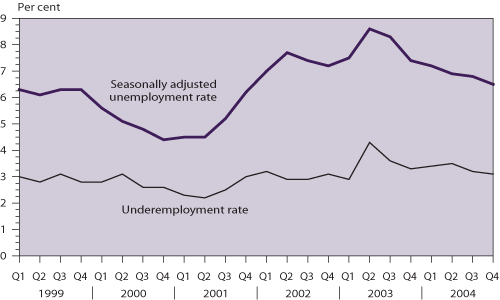
extended scope. The seasonally adjusted unemployment rate and the
number of unemployed both fell steadily during the year, to 6.5
per cent and 226 900 respectively in the fourth quarter. These
represented the lowest levels since November 2001 to January 2002.
For 2004 as a whole, the unemployment rate and the number of unemployed
averaged 6.8 per cent and 241 400 respectively. Though still
high by historical standards, they were lower than those of 7.9
per cent and 277 200 in 2003. This decrease, whilet occurring
extensively across many economic sectors, was most apparent in construction
and the tourism and consumption-related sectors. Furthermore, the
median duration of unemployment shortened from 109 days at end-2003
to 99 days at end-2004.
The underemployment rate also came down during
2004, albeit less visibly, to 3.1 per cent. So did the number of
underemployed, to 110 800. For 2004 as a whole, the underemployment
rate and the number of underemployed averaged 3.3 per cent and 116 200,
respectively, below those of 3.5 per cent and 123 300 in 2003.
The decrease was concentrated in the restaurants, hotels and transport
sectors. This was partly due to a shift in the employment composition
from part-time and temporary workers to full-time workers, as more
full-time jobs became available amid continued pick-up in business
activity (Chart 10).
| Chart 10 |
| Unemployment and underemployment
rates |
| |
 |
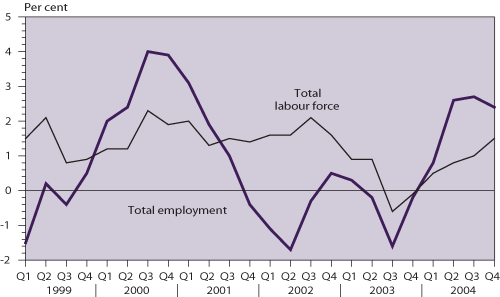
The total labour force stayed on a steady growth
path, expanding by 0.3 per cent in 2003 and by 0.9 per cent in 2004.
The latest increase was attributable entirely to an expansion in
the population of working age by 1.1 per cent, more than offsetting
the decline in the labour force participation rate, especially for
male workers aged 15-24 and 50-59.
By comparison, overall labour demand showed a more
notable increase in 2004. This was manifested not only by more intensive
utilisation of existing manpower resources, but also by increased
job openings and employment of additional staff. As an indicator,
total employment as enumerated from households rose by 2.1 per cent
in 2004, reversing the 0.4 per cent fall in 2003. Growth was modest
in the first quarter, but picked up momentum the rest of the year.
At end-2004, total employment reached an all-time high of 3.33 million.
Compared with the trough in mid-2003, this represented a large gain
of 139 400 or 4.4 per cent. Much of the growth occurred among higher
skilled workers in the import/export trade and financing and education
services sectors, as well as among the lower skilled ones including
service workers and shop sales workers in the wholesale/retail trade,
restaurants and miscellaneous personal services sectors, craft and
related workers in the construction sector, and workers in elementary
occupations in the transport and real estate sectors. Also, the
more experienced workers aged 40 to 59 seemed to have benefited
more from the improved employment situation (Chart 11).
| Chart 11 |
| Total labour force and total
employment |
| (year-on-year rate of change) |
 |
Total employment as enumerated from private sector
establishments likewise went up appreciably by 3.1 per cent in December
2004 over a year earlier. This was attributable entirely to a 4
per cent increase in the service sectors, with growth impetus coming
from all broad service sectors. For 2004 as a whole, total employment
in the private sector was 2.4 per cent higher than in 2003. The
corresponding growth rate for the service sectors was 3.2 per cent.
The local manufacturing sector registered a reduction
in employment by 1.8 per cent in December 2004 from a year earlier,
owing to continued relocation of production across the boundary.
Employment of manual workers at building and construction sites
likewise shrank, by 9.4 per cent over the same period, consequential
to the scale-back in the Public Housing Programme and winding down
or completion of several major civil engineering projects. For 2004
as a whole, employment in these two non-service sectors fell by
3 per cent and 6 per cent respectively.
Job vacancies in the private sector have reverted
to an uptrend since the latter part of 2003. In December 2004, the
total number of private sector vacancies jumped by 39.8 per cent
over a year earlier. For 2004 as a whole, the increase was more
impressive, at 55.8 per cent.
Growth over the past year was broadly based in
general, whether analysed by economic sector or by occupational
category. Vacancies in both the service sector and the manufacturing
sector went up significantly by 39 per cent and 61.7 per cent respectively.
Meanwhile, notable gains were also observed across various occupational
categories. More specifically, vacancies at the lower and upper
segments leaped by 15.8-82.9 per cent and 29.6-99.2 per cent respectively
in December 2004 over a year earlier.
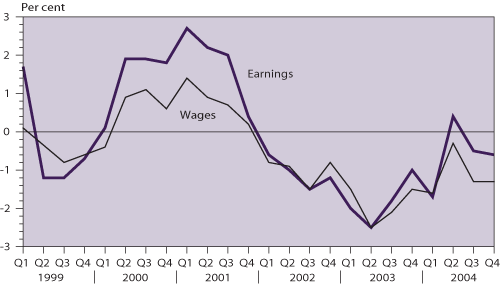
Labour income, as a lagging indicator, remained
soft in money terms, but the decrease was smaller in 2004 than in
2003. Specifically, overall labour earnings in the private sector,
as measured by payroll per person engaged, edged lower by 0.6 per
cent year-on-year in money terms in the fourth quarter of 2004 and
by 0.7 per cent in 2004 (Chart 12). In real terms, the
corresponding decreases where 0.9 and 0.2 per cent.
| Chart 12 |
| Earnings and wages |
| (year-on-year rate of change
in money terms) |
 |
Analysed by economic sector, labour earnings in
the service sectors exhibited divergent movements. While year-on-year
increases in money terms were observed for the wholesale and import/export
trades, restaurants and hotels, financing, insurance, real estate,
and miscellaneous personal services in the fourth quarter of 2004,
these were more than offset by declines in other sectors such as
the retail trade, land transport and business services. For all
the service sectors taken together, labour earnings were down by
0.7 per cent in money terms or 0.9 per cent in real terms. Over
the same period, labour earnings in the local manufacturing sector
nevertheless increased mildly by 0.3 per cent in money terms or
0.1 per cent in real terms.
Overall labour wages in the private sector, excluding
the irregular payment items, edged lower, by 1.3 per cent in money
terms or 1.7 per cent in real terms in December 2004 from a year
earlier. For 2004 as a whole, the corresponding decreases were 1.1
per cent and 1.2 per cent.
Analysed by economic sector, wages in the service
sectors were adjusted downwards by 1.1-1.8 per cent in money terms
in December 2004 from a year earlier, save for those in personal
services, which were lifted by 1.8 per cent attributable to pay
hikes at barber and beauty shops. In real terms, there were wage
decreases of 1.6-2.3 per cent for most service sectors, but a 1.3
per cent rise for personal services. In the manufacturing
and construction sectors, wages were down by 1.7 per cent and 2.6
per cent respectively in money terms, corresponding to decreases
of 2.2 per cent and 3 per cent in real terms.
The Property Market
The property market continued to pick up markedly
in early 2004 in terms of both prices and trading activity, as market
sentiment improved during the economic upturn. The low interest
rate environment amid keen competition in the mortgage loan market
rendered further support to the property market. Following a brief
consolidation in mid-year caused by concerns over higher interest
rates, economic tightening measures in the Mainland and the oil
price upsurge, the property market perked up again in the latter
part of the year as local economic fundamentals continued to strengthen
and deflation ended. The sales market for residential property appeared
to have been stimulated by favourable land auction results in June
and by removal of the security of tenure provisions for domestic
tenancies in early July. Expansion of the Mortgage Insurance Programme
between late July and the year-end also helped lift end-user demand.
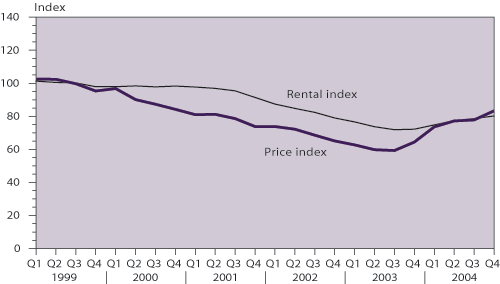
The sales market for residential property was buoyant
for 2004 as a whole, with particularly hectic trading activity in
the secondary market. Flat prices in both the mass market and the
luxury market rose markedly during the year, particularly in the
luxury market. On a quarter-to-quarter comparison, flat prices in
the first quarter of 2004 registered the first double-digit increase
in the past seven years, followed by modest rises in the ensuing
three quarters. By the fourth quarter of 2004, overall flat prices
have soared by an average of 30 per cent over the same quarter in
2003, the highest price level since the fourth quarter of 2000.
As to the rental market, flat rentals picked up steadily throughout
2004, and were 11 per cent higher in the fourth quarter of 2004
than a year earlier. Yet compared with their peaks in the third
quarter of 1997, flat prices and rentals in the fourth quarter of
2004 were still substantially lower, on average by 51 per cent and
42 per cent respectively (Chart 13).
| Chart 13 |
| Prices and rentals of residential
property |
| (1999=100) |
 |
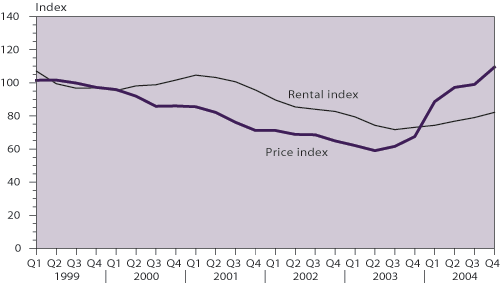
On commercial property, bolstered by keen investor
interest amid an optimistic business outlook, the sales market for
office space picked up sharply in the first quarter of 2004 and
stayed buoyant in the second quarter. It then went through a brief
consolidation in the third quarter owing to uncertainties in the
external environment, but bounced back swiftly in the fourth quarter
as local business activity continued to prosper. By the fourth quarter
of 2004, prices for office space on average have surged by 65 per
cent from a year earlier. Office rentals also picked up during most
of 2004, with rentals of Grade A office space registering the strongest
increase. There was ongoing upgrading and relocation of office space
from the fringe areas to quality premises in the prime locations,
as rentals of Grade A office space had fallen to an attractive level
and as business activity saw further growth. In the fourth quarter
of 2004, office rentals were up by an average of 12 per cent over
a year earlier. Against their respective peak levels in 1994, prices
and rentals for office space in the fourth quarter of 2004 were
lower by an average of 53 per cent and 57 per cent (Chart 14).
| Chart 14 |
| Prices and rentals of office
space |
| (1999=100) |
 |
The sales and rental markets for shopping space
were generally supported by brisk retail activity amid continued
revival in local consumer demand and buoyant inbound tourism in
2004. Retail premises in popular locations and in better-managed
shopping malls were in particularly strong demand. In the fourth
quarter of 2004, prices and rentals for shopping space rose on average
by 40 per cent and 10 per cent respectively over the fourth quarter
of 2003, but were on average 31 per cent and 23 per cent lower than
their respective peaks in the third quarter of 1997.
On industrial property, with end-user demand strengthened
by buoyant export growth and investor sentiment apparently lifted
by CEPA, prices for flatted factory space registered appreciable
increases throughout 2004. In the fourth
quarter of 2004, prices for flatted factory space rose by 34 per
cent over a year earlier. Concurrently, rentals of industrial space
also picked up, albeit at a much slower pace, by 6 per cent over
the same period. Compared with their peaks in 1994, prices and rentals
for industrial space in the fourth quarter of 2004 were still significantly
lower, by an average of 56 per cent and 48 per cent respectively.
Regarding supply of new property, completions of
private residential flats declined by 1 per cent in 2004 to 26 000
units, smaller than the 15 per cent drop in 2003. On the other hand,
completions of office space fell by 6 per cent in terms of internal
floor area in 2004, having surged by 80 per cent in 2003. Completions
of other commercial premises likewise declined, by 23 per cent in
2004, following a 15 per cent fall in 2003. Completions of conventional
flatted factory space in 2004 were only 800 square metres, after
nil completions in 2003. There were nil completions of industrial-cum-office
space in 2004, following completions of 14 800 square metres in
2003. With an across-the-board rise in new take-ups,
vacancy rates for almost all types of property in the private sector
decreased, to 6.2 per cent for residential flats, 12.7 per cent
for office space, 10.8 per cent for shopping space, 8.7 per cent
for conventional flatted factory space, and 11.1 per cent for industrial-cum-office
space at end-2004.
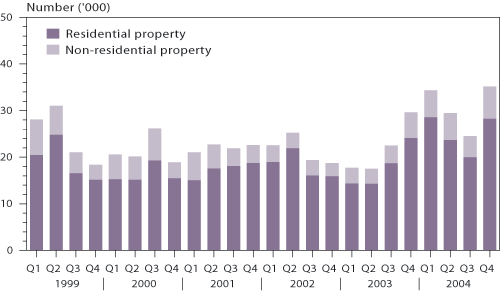
Property transactions, as measured by agreements
for sale and purchase of property registered with the Land Registry,
leaped by 41 per cent in number and 86 per cent in value in 2004,
much faster than the modest 2 per cent increase in both number and
total value in 2003. While the upsurge reflected the revival of
the property market over the course of 2004, it was also partly
attributable to a low base of comparison for the early part of the
year due to the SARS impact in 2003. Within the total, transactions
of residential property soared by 41 per cent in number and 80 per
cent in value in 2004, while the respective increases for non-residential
property were even stronger, at 45 per cent and 109 per cent (Chart
15).
| Chart 15 |
| Sale and purchase agreements
by broad type of property |
| |
 |
Price Movements
The economy came out of a protracted period of
deflation that has started since November 1998. As the pricing power
of retailers returned along with the economic recovery, the rise
in import prices stemming from a weak dollar and firming world commodity
prices was more readily passed through to the retail price level.
Prices of a wide range of consumer goods and services thus resumed
increases after early 2004. Yet price pressures on the consumption
front remained modest all through the second half of 2004, as wages
and earnings remains subdued in overall terms, while the rebound
in property rentals over the previous year had yet to show up fully.
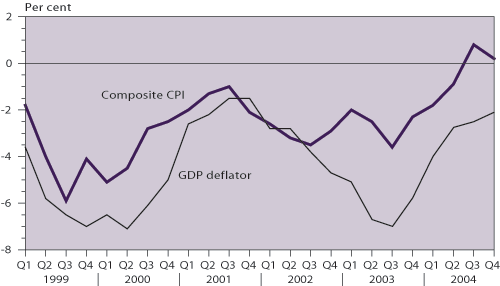
On a year-on-year basis, the declines in both the Composite Consumer
Price Index (CCPI) and the GDP deflator tapered successively over
the course of the year, with the former reverting to small increases
in the second half. Yet the pace of upturn in the GDP deflator was
considerably slower than that of the Composite CPI, due to the drag
from worsened terms of trade caused by the further weakening of
the US dollar. For 2004 as a whole, the declines in the CCPI and
GDP deflator narrowed to 0.4 per cent and 2.8 per cent respectively
(Chart 16).
| Chart 16 |
| Main inflation indicators |
| (year-on-year rate of change) |
 |
|