|
With its strategic location at the doorway to the Mainland and on the
international time zone that bridges the time gap between Asia and Europe,
the HKSAR has been serving as a global centre for trade, finance, business
and communications. Hong Kong is now ranked the 11th largest trading entity
in the world. It operates the busiest container port in the world in terms
of throughput, as well as one of the busiest airports in terms of number
of international passengers and volume of international cargo handled.
In addition, it is the world's 12th largest banking centre in terms of
external banking transactions, and the seventh largest foreign exchange
market in terms of turnover. Its stock market is Asia's second largest
in terms of market capitalisation.
Hong Kong is characterised by a high degree of internationalisation,
business-friendly environment, rule of law, free trade and free flow of
information, open and fair competition, well-established and comprehensive
financial network, superb transport and communications infrastructure,
sophisticated support services, and a skilled and well educated workforce
complemented by a pool of effective and enterprising entrepreneurs. Added
to these are the substantial amount of fiscal reserves and foreign exchange
reserves, a fully convertible and stable currency, and a simple tax system
with a low tax rate. On these virtues, Hong Kong is widely regarded as
amongst the freest and most competitive economies in the world. The US
Heritage Foundation ranks Hong Kong as the world's freest economy for
the 10th year in a row in 2004. The Cato Institute of the United States,
in conjunction with the Fraser Institute of Canada and other research
bodies around the world, also consistently ranks Hong Kong as the freest
economy in the world.
Over the past two decades, the Hong Kong economy has
more than doubled in size, with GDP growing at an average annual rate
of 5.0 per cent in real terms. This outpaces considerably the growth of
the world economy and the Organisation for Economic Cooperation and Development
(OECD) economies. Over the same period, Hong Kong's per capita GDP doubled
at constant price level, giving an average annual growth rate of 3.7 per
cent in real terms. At US$23,300 in 2003, this per capita GDP was amongst
the highest in Asia, next only to Japan (Chart 1).
In line with increased external orientation of the
Hong Kong economy, trade in goods expanded by eight times and trade in
services by almost three times in real terms over the past two decades.
In 2003, the total value of visible trade (comprising re-exports, domestic
exports and imports of goods) reached $3,543 billion, corresponding to
287 per cent of GDP. This was distinctly larger than the ratios of 156
per cent in 1983 and 230 per cent in 1993. If the value of exports and
imports of services is also taken into account, the ratio is even greater,
at 331 per cent in 2003, as compared to 192 per cent in 1983 and 267 per
cent in 1993.
Chart 1
|
Gross Domestic Product |
|
(year-on-year rate of change
in real terms) |
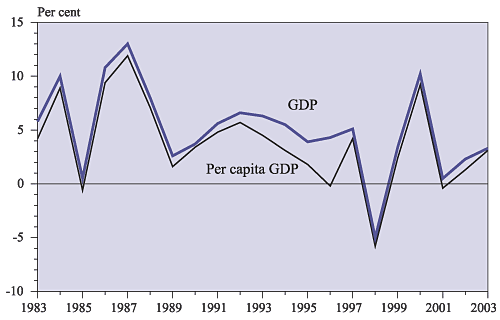 |
|
Over the past two decades, the Hong Kong economy
grew at an average annual rate of 5.0 per cent in real terms, outpacing
the corresponding growth rate of 2.8 per cent for OECD economies
as a whole. In 2003, the economy still attained a 3.3 per cent growth
in real terms, despite the impact of SARS. |
As another indication of the high degree of external
orientation, the stock of inward direct investment in Hong Kong amounted
to $2,622 billion in market value at end-2002, equivalent to 208 per cent
of GDP. Hong Kong is the second most favoured destination for inward direct
investment in Asia, next only to the Mainland. The corresponding figures
for the stock of outward direct investment in Hong Kong were likewise
substantial, at $2,413 billion and 192 per cent of GDP, much larger than
those for many other economies in Asia. As a major financial centre in
the region with huge cross-territory fund flows, Hong Kong's external
financial assets and liabilities were also substantial, at $8,033 billion
and $5,355 billion respectively at end-2002. The corresponding ratios
to GDP in that year were 638 per cent and 425 per cent. Reflecting Hong
Kong's sound international investment position, net external financial
assets amounted to $2,677 billion at end-2002, equivalent to 213 per cent
of GDP. As to gross external debt, which is the sum of the non-equity
liability components in international investment, it stood at $2,803 billion
at end-2003, equivalent to 227 per cent of GDP. Yet a major proportion
of it arose from normal operations of the banking sector, and the Government
incurred no external debt at all.
The Gross National Product (GNP), comprising GDP and
net external factor income flows, stood at $1,269 billion in 2003. This
was higher than the corresponding GDP by 2.8 per cent, owing to sustained
net inflow of external factor income. In gross terms, inflows and outflows
of external factor income remained substantial in 2003, at $329 billion
and $294 billion respectively, equivalent to 27 per cent and 24 per cent
of GDP. This was related to the huge volume of both inward and outward
investment in Hong Kong.
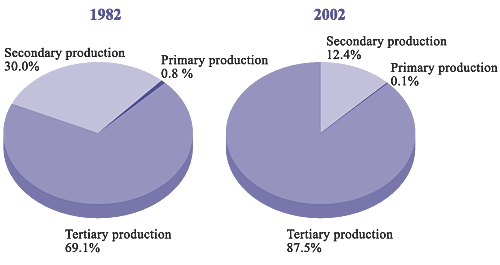
Primary production (including agriculture, fisheries, mining and quarrying)
is insignificant in Hong Kong, in terms of both value added contribution
to GDP and share in total employment. This reflects the predominantly
urbanised nature of the economy.
Secondary production (comprising manufacturing, construction,
and supply of electricity, gas and water), which constituted a significant
contributor to GDP up to the early 1980s, has diminished in relative importance
since then. Within this broad sector, the value added contribution from
manufacturing shrank from 21 per cent in 1982 to 14 per cent in 1992 and
distinctly more to only 5 per cent in 2002, consequential to ongoing relocation
of the more labour-intensive production processes to the Mainland. For
the construction sector, its contribution to GDP edged lower from 7 per
cent in 1982 to 5 per cent in 1992, and further to 4 per cent in 2002.
As to supply of electricity, gas and water, the corresponding share held
relatively stable, at around 2-3 per cent over the past two decades.
The open door policy and economic reform in the Mainland
have not only provided an enormous production hinterland and market outlet
for Hong Kong's manufacturers, but have also created abundant business
opportunities for a wide range of service activities. These activities
include specifically freight and passenger transport, travel and tourism,
telecommunications, banking, insurance, real estate, and professional
services such as financial, legal, accounting and consultancy services.
In consequence, the Hong Kong economy has become increasingly service-oriented
since the 1980s.
Reflecting this, the share of the tertiary services
sector (comprising the wholesale, retail and import/export trades, restaurants
and hotels; transport, storage and communications; financing, insurance,
real estate and business services; community, social and personal services;
and ownership of premises) in GDP went up visibly, from 69 per cent in
1982 to 79 per cent in 1992 and further to 88 per cent in 2002 (Chart
2).
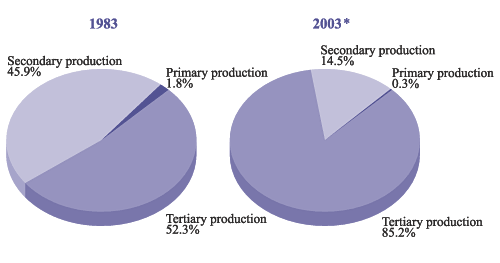
The profound change in the economic structure was
also borne out by a broadly similar shift in the sectoral composition
of employment. Over the past two decades, the share of the services sector
in total employment followed a continuous uptrend, rising distinctly from
52 per cent in 1983 to 73 per cent in 1993 and further to 85 per cent
in the first three quarters of 2003. On the other hand, the corresponding
share for the manufacturing sector kept on shrinking, from 38 per cent
in 1983 to 18 per cent in 1993 and further to only 5 per cent in the first
three quarters of 2003 (Chart 3).
The services sector has not only flourished but also diversified in
types of activities, concomitant with the structural transformation of
the economy. Trade-related and tourism-related services, community, social
and personal services, and finance and business services such as banking,
insurance, real estate and a host of related professional services, have
all grown distinctly over the past two decades. Strong expansion was also
observed in information technology in the more recent years, especially
those pertaining to telecommunications services and Internet applications,
in line with the shift in economic structure more towards knowledge-based
activities.
Chart 2
|
Gross Domestic Product by broad economic sector |
|
|
|
Along with a profound shift in economic structure,
the share of the tertiary services sector in GDP continued to increase,
while the share of the secondary sector dwindled further over the
past two decades. |
Chart 3
|
Employment by broad economic sector |
|
|
|
Consequential to the ongoing relocation of the
less skill-intensive and lower value added manufacturing processes
to the Mainland, as well as the strong growth in service activities
in Hong Kong, the tertiary services sector has expanded markedly
and has overtaken the secondary sector to become the largest employer
in the economy since 1981.
* Average of Q1 to Q3 2003. |
On trade in services, exports and imports of services
both grew by an annual average of 7 per cent in real terms over the past
two decades. In 2002, civil aviation, travel and tourism, trade-related
services, and various financial and banking services were the largest
components of trade in services. Within exports of services, offshore
trading and merchandising services have overtaken transportation as the
most important component in 2002, accounting for 35 per cent of the total
value in that year. For transportation, the corresponding share was 30
per cent. This was followed by travel and tourism (with a share of 17
per cent), and financial and banking services (6 per cent). As to imports
of services, travel and tourism remained the largest component, accounting
for 50 per cent of the total value in 2002. Transportation was in the
second place (with a share of 26 per cent), followed by offshore trading
and merchandising services (7 per cent), and financial and banking services
(3 per cent).
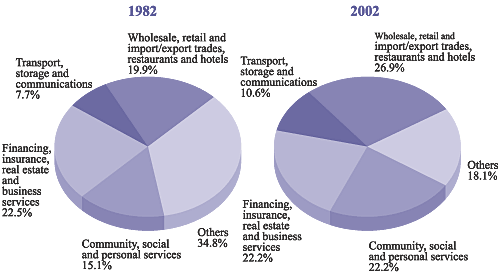
Net output or value added of the services sector as
a whole rose visibly, by an annual average of 6 per cent in value terms
between 1992 and 2002. Amongst the major constituent sectors, net output
of community, social and personal services had the fastest growth (at
an average annual rate of 9 per cent). This was followed by transport,
storage and communications (6 per cent); the wholesale, retail and import/export
trades, restaurants and hotels (5 per cent); and financing, insurance,
real estate and business services (4 per cent).
In terms of value added contribution to GDP, the
wholesale, retail and import/export trades, restaurants and hotels continued
to be the largest in 2002, with a share of 27 per cent. This was followed
by community, social and personal services (22 per cent), financing, insurance,
real estate and business services (22 per cent), and transport, storage
and communications (11 per cent) (Chart 4).
Chart 4
|
Gross Domestic Product by major service sector |
|
|
|
Over the past two decades, community, social and
personal services had a more distinct increase in net output than
other major service sectors. Yet ranked in terms of value added
contribution to GDP, the wholesale, retail and import/export trades,
restaurants and hotels remained the largest service sector in 2002. |
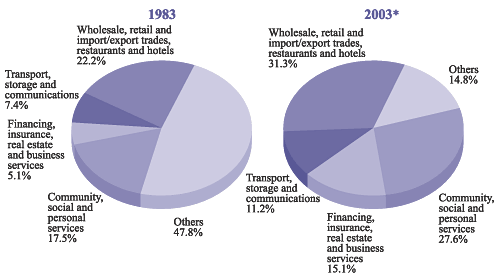
In terms of employment, the wholesale, retail and import/export trades,
restaurants and hotels was again the largest sector, accounting for 31
per cent of the total employment in the first three quarters of 2003.
This was followed by community, social and personal services (with a share
of 28 per cent), financing, insurance, real estate and business services
(15 per cent), and transport, storage and communications (11 per cent)
(Chart 5).
Chart 5
|
Employment by major service sector |
|
|
|
Over the past two decades, financing, insurance,
real estate and business services showed the fastest employment
growth. But in terms of employment size, the wholesale, retail and
import/export trades, restaurants and hotels continued to be the
largest employer in the economy in 2003.
* Average of Q1 to Q3 2003. |
Manufacturing firms in Hong Kong are renowned for their versatility
and flexibility in coping with changing demand conditions in the overseas
markets. Moreover, through increased outward processing arrangements in
the Mainland, Hong Kong's productive capacity has effectively been expanded
by multiples, which has helped uphold the price competitiveness of its
products.
Besides relocating the more labour-intensive production
processes to the Mainland, Hong Kong's manufacturers have also been striving
hard to diversify their products and markets, in face of the challenges
from globalisation of trade and keen competition from other export producers.
Concurrently, productive efficiency and product quality have been continuously
upgraded by incorporating more advanced skills and technology.
Within the local manufacturing sector, textiles and
clothing remain the most important industries, notwithstanding continued
decline in their relative significance over the years. Other major industries
include machinery and equipment, electronics, printing and publishing,
food processing and metal products. Generally speaking, those manufacturing
operations still remaining in Hong Kong are more knowledge-based with
a higher value added and a greater technology content. Between 1993 and
2003, labour productivity in the local manufacturing sector, as measured
by the ratio of the industrial production index to the manufacturing employment
index, rose visibly, by an annual average of around 6 per cent.
In 2003, the United States and the Mainland were the
two largest markets for Hong Kong's domestic exports, accounting for 32
per cent and 30 per cent respectively of the total. Other major markets
included the United Kingdom (6 per cent), Germany (4 per cent), Taiwan
(3 per cent), Japan (2 per cent), and the Netherlands (2 per cent). In
the more recent years, new markets have been developed for Hong Kong's
exports, including markets in the Middle East, Eastern Europe, Latin America
and Africa.
Since the Mainland adopted its economic reform and open door policy in
1978, economic links between Hong Kong and the Mainland have gone from
strength to strength. This has brought substantial economic benefits to
both places.
Visible trade between Hong Kong and the Mainland has
expanded rapidly since 1978, at an average annual rate of 22 per cent
in value terms. But the pace of growth moderated in the more recent years,
to an annual average of 8 per cent during 1993-2003, partly due to increased
direct shipment of goods into and out of the Mainland upon enhancement
of port facilities and simplification of customs procedures there. The
Mainland remained Hong Kong's largest trading partner in 2003, accounting
for 43 per cent of the total trade value in Hong Kong. The bulk (specifically,
91 per cent) of Hong Kong's re-export trade was related to the Mainland,
making it the largest market for as well as the largest source of Hong
Kong's re-exports. Reciprocally, Hong Kong was the Mainland's third largest
trading partner in 2003 (after Japan and the United States), accounting
for 10 per cent of the Mainland's total trade value (Chart
6).
In the more recent years, there has been an increasing
shift in the mode of Hong Kong-Mainland trade from re-exports to offshore
trade. Between 1990 and 1995, Hong Kong's exports of trade-related services
grew at an annual average rate of 5 per cent in real terms, much slower
than the growth in re-exports involving the Mainland, at an annual average
rate of 22 per cent. The growth pattern was reversed during 1995 to 2003,
when exports of trade-related services surged at an average annual rate
of 15 per cent in real terms, outpacing the growth in re-exports involving
the Mainland, at an average annual rate of 7 per cent.
Over the past two decades, there has also been a sharp
increase in people, service and investment flows between Hong Kong and
the Mainland. Hong Kong is a major service centre for the Mainland generally
and South China in particular, providing a wide array of financial and
other business support services like banking and finance, insurance, transport,
accounting and sales promotion.
Hong Kong is also a principal gateway to the Mainland
for business and tourism. Between 1993 and 2003, the number of trips made
by Hong Kong residents to the Mainland grew at an average annual rate
of 9 per cent to 53 million trips, and the number of trips made by foreign
visitors to the Mainland through Hong Kong at an average annual rate of
4 per cent to 2.7 million trips. Yet, mainly due to the outbreak of SARS
in the region in the first half of the year, these two particular types
of trips decreased by 6 per cent and 21 per cent respectively in 2003.
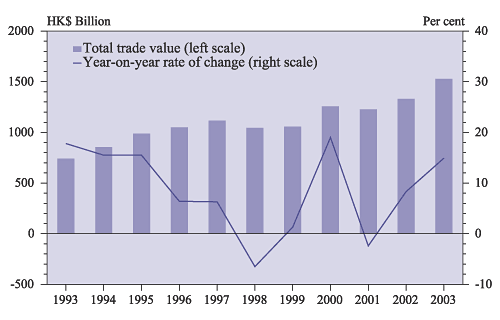
Chart 6
Visible trade between Hong Kong and the
Mainland
|
|
|
|
Since the Mainland adopted its economic reform
and open door policy in 1978, there has been a rapid expansion in
merchandise trade, especially re-export trade, between Hong Kong
and the Mainland. |
Moreover, Hong Kong is a major source of external
direct investment in the Mainland. The cumulative value of Hong Kong's
realised direct investment in the Mainland amounted to US$218 billion
at end-September 2003, accounting for about half of the total inward direct
investment there. Over the years, there has been a noticeable shift in
the composition of Hong Kong's direct investment across the boundary,
from industrial processing to a wider spectrum of business ventures, such
as hotels and tourist-related facilities, real estate and infrastructure
development. Relative to other places in the Mainland, Hong Kong's economic
links with Guangdong are the most intimate. At end-2002, the cumulative
value of Hong Kong's realised direct investment in Guangdong was US$86
billion, accounting for 69 per cent of its total inward direct investment.
According to a survey conducted by the Federation of Hong Kong Industries
in December 2003, 11 million Mainland workers were employed directly or
indirectly in the Mainland by industrial ventures with Hong Kong interests,
of whom 10 million were in Guangdong. This is about 57 times the size
of Hong Kong's own manufacturing workforce.
In the opposite direction, there has likewise been
a sizeable flow of investment capital from the Mainland to Hong Kong over
the past years. By end-2002, the Mainland had invested a total of US$76
billion in Hong Kong, making it the largest source of external direct
investment here. Over 2 000 Mainland enterprises currently operate in
Hong Kong, with total assets amounting to US$220 billion. Mainland enterprises
take up a significant role in such major economic sectors as banking,
insurance, shipping and tourism, reportedly accounting for about 25 per
cent of the market shares in those sectors. Mainland enterprises also
maintain high investment stakes in other lines of business such as the
import/export trade, the wholesale/retail trade, warehousing, real estate
and infrastructure development.
In tandem with the upsurge in cross-boundary business
activities, financial links between Hong Kong and the Mainland have strengthened
substantially over the past years. Hong Kong's authorised institutions'
external claims on and liabilities to entities in the Mainland were generally
on the rise over the period. Comparing end-2003 with a year earlier, external
liabilities of Hong Kong's authorised institutions to entities in the
Mainland grew by 13 per cent to $326 billion, and their external claims
on entities in the Mainland even faster by 41 per cent to $179 billion.
The Bank of China (Hong Kong) Limited is the second
largest banking group in Hong Kong, after the HSBC Group. It is also one
of the note-issuing banks in Hong Kong, besides the Hongkong Bank and
the Standard Chartered Bank. As to the other three state-owned commercial
banks, namely the China Construction Bank, the Agricultural Bank of China,
and the Industrial and Commercial Bank of China, they have all been granted
banking licences to operate in Hong Kong since 1995. On the other hand,
the HSBC Group, the Bank of East Asia and the Standard Chartered Bank
are amongst the best-represented foreign banks in the Mainland.
Hong Kong has been serving as a major funding centre
for the Mainland. Besides being a direct source of funds, it also provides
a window through which foreign funds can be channelled efficiently into
the Mainland for financing development projects there. While syndicated
loans remain the most important means for Mainland-related enterprises
to raise funds in Hong Kong, issuance of securities has become increasingly
popular in the more recent years. In 2003, listing activities by Mainland
enterprises continued to be a prominent feature in Hong Kong's stock market,
especially so in the latter part of the year when the market staged a
visible upturn amidst improved investor sentiment. By end-2003, a total
of 64 state-owned enterprises in the Mainland had been listed on the Main
Board of Hong Kong's stock market, raising a total equity capital of $191.3
billion. Amongst them, 10 were listed in 2003, raising $46.8 billion.
In addition, another 72 non-state-owned Mainland enterprises had likewise
been listed by end-2003, raising a total equity capital of $590.4 billion.
Of these, one was listed in 2003, raising $4.7 billion. On the Growth
Enterprise Market, there were 28 state-owned enterprises, raising a total
equity capital of $4.0 billion. All these listings have helped broaden
the base of Hong Kong's stock market, and entrench further Hong Kong's
position as a major fund raising centre in the region.
The signing of CEPA on June 29, followed by the signing
of its six Annexes on September 29, serve to expand further business opportunities
between Hong Kong and the Mainland, by enlarging the scope for cross-boundary
trade, service and investment flows. Under CEPA, the Mainland will accord
zero tariff as from January 1, 2004 for exports from Hong Kong meeting
the rules of origin requirement in 374 Mainland product codes. On services,
Hong Kong companies will be allowed to have earlier entry and wider market
access, as well as to form wholly-owned or majority-owned subsidiaries
in 18 service sectors in the Mainland. CEPA also facilitates trade and
investment between Hong Kong and the Mainland through promoting cooperation
in customs clearance, electronic commerce, transparency in laws and regulations,
and other procedures.
With continuing reform and liberalisation of the
Mainland economy, particularly after China's entry into the World Trade
Organisation, more foreign investment can be expected to flow into the
Mainland. Hong Kong's service hub role for the Mainland will continue
to strengthen. Hong Kong possesses a strong niche in partnering with as
well as in providing various business support services to foreign enterprises
seeking to enter the Mainland market. In the other direction, as more
Mainland enterprises seek to extend their business outward, Hong Kong
can also help them to gain access to the overseas markets.
|