The Economy in 1999
External Trade
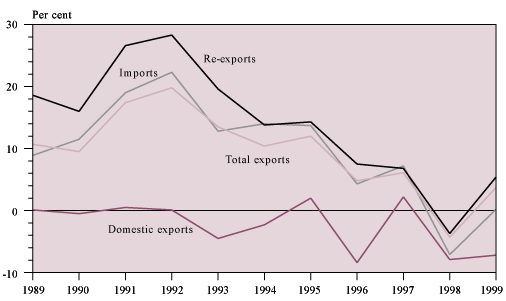
Export performance staged a strong recovery over the course of 1999, reversing the downtrend in 1998. Exports of goods remained slack in overall terms in the first half of 1999, but exhibited a distinct upturn in the third quarter, and accelerated markedly in growth in the fourth quarter. This was largely attributable to the resurgence in exports to East Asia during the year, amidst a broad-based revival in import demand in tandem with economic recovery in the region. Of particular note was the sharp rise in exports to the Mainland in the second half of the year, especially in respect of material inputs for export processing. As to the conventional overseas markets, exports to the United States accentuated in growth, while exports to the European Union also picked up significantly. Apart from the robust demand in these markets, improved price competitiveness consequential to the cost adjustment in the local economy and the rebound in many of the East Asian currencies also helped.
For 1999 as a whole, total exports of goods (comprising re-exports and domestic exports) went up by 4 per cent in real terms, in contrast to a 4 per cent decline in 1998. Reflecting the progressive leap during the year, total exports, having decreased by 5 per cent and 2 per cent respectively in real terms in the first and second quarters, revived strongly to grow by 8 per cent in the third quarter and further by 12 per cent in the fourth quarter. On a seasonally adjusted quarter-to-quarter comparison, total exports edged up by 1 per cent and 3 per cent respectively in real terms in the first and second quarters of 1999, and then rose further by 4 per cent in the third quarter and 3 per cent in the fourth quarter.
Within total exports, re-exports rose by 5 per cent in real terms in 1999, reversing the 4 per cent fall in 1998. The performance of domestic exports was however still modest, affected by the ongoing structural shift towards re-exports and offshore trade. Notwithstanding some improvement towards the year-end, domestic exports still fell by 7 per cent in real terms for 1999 as a whole, only marginally improved from the 8 per cent decrease in 1998.
Mirroring closely the pick-up in re-exports during the year and also incorporating the rebound in retained imports towards the year-end, imports of goods staged a strong upturn after mid-1999. For 1999 as a whole, imports showed virtually no change in real terms, which was already a notable improvement from the 7 per cent decrease in 1998. Analysed by source of Hong Kong's imports, the Mainland remained the largest supplier, accounting for 44 per cent of the total value in 1999. Other major suppliers included Japan (with a share of 12 per cent), Taiwan (7 per cent), and the United States (7 per cent).
| Chart
7: Hong Kong's visible trade (year-on-year rate of change in real terms) |
|
 |
|
| Export performance staged a
strong recovery over the course of 1999, reversing the downtrend in 1998. This was largely attributable to the resurgence in exports to East Asia during the year, amidst a broad-based revival in import demand in line with economic recovery in the region. |
With the value of total exports showing little change but the value of imports still shrinking for the year as a whole, the visible trade deficit narrowed further, to $43.7 billion or 3.1 per cent of the value of imports in 1999. These were substantially smaller than the corresponding figures of $81.4 billion and 5.7 per cent in 1998.
On invisible trade, exports of services likewise staged a significant rebound in 1999. Apart from having a sustained growth in inbound tourism, there was a surge in offshore trading activities upon the distinct turnaround in export performance in the Mainland. Exports of other trade-related and business services also picked up, along with the economic revival in the region. For 1999 as a whole, exports of services went up by 6 per cent in real terms, in contrast to the 7 per cent decline in 1998. Yet imports of services were modest throughout 1999, reflecting the weak domestic demand in the early part of the year as well as fewer trips by Hong Kong residents to Taiwan immediately after the earthquake there in September. For 1999 as a whole, imports of services fell by 1 per cent in real terms, the same as the decrease in 1998. With exports of services surging but imports of services still slack, the invisible trade surplus widened considerably further in 1999, by 11 per cent to $101 billion. This more than offset the deficit on the visible trade account, giving a combined surplus (including an estimate of imports of gold for industrial use) of $54 billion in 1999, corresponding to 3.5 per cent of the total value of imports of goods and services in that year. Both were markedly higher than the corresponding figures of $6 billion and 0.4 per cent in 1998.
Domestic Demand
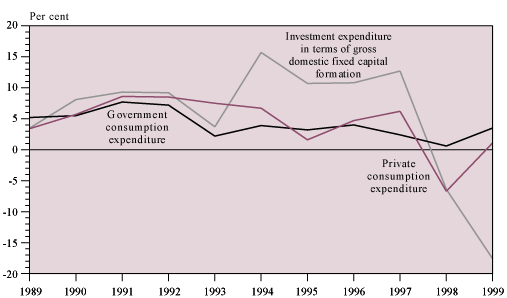
Local consumer spending remained slack in the early part of 1999. Nevertheless, as overall economic conditions turned better and the employment situation stabilised, there was a visible pick-up in consumer spending in the remainder of the year. The prevalence of price discounts at the retail outlets also helped stimulate demand. Initially, the recovery occurred mainly in consumption of services. It then spread to clothing and footwear, and further to high-value items such as motor vehicles, furniture and various other consumer durables. Private consumption expenditure (PCE), after falling by 4.4 per cent in real terms in the first quarter of 1999 over a year earlier, bounced back to an increase of 1.3 per cent in the second quarter. Growth strengthened to 3.0 per cent in the third quarter and then to 4.5 per cent in the fourth quarter. This gave an increase of 1.1 per cent in real terms in PCE for 1999 as a whole, reversing the decrease of 6.7 per cent in 1998.
Overall investment spending shrank markedly further, by 17.6 per cent in real terms in 1999, following a 6.4 per cent decline in 1998. Within this total, expenditure on machinery and equipment plunged by 19.4 per cent in real terms in 1999, after a 6.6 per cent decline in 1998. Investment spending in this vein was deterred by concern about the business outlook, particularly in the early part of the year, and also by relatively high real interest cost and credit stringency. Yet as the economy picked up and business outlook turned better, machinery and equipment acquisition by the private sector turned around towards the year-end. Expenditure on building and construction was 10.8 per cent lower in real terms in 1999, following a 4.6 per cent decrease in 1998. Nevertheless, with intensification of work on the priority railway projects and other infrastructural projects, and also with the Public Housing Programme continuing apace, public sector building and construction output revived to a strong growth since the third quarter. On the other hand, with the existing building projects being progressively wound down and new building projects yet to gather momentum, private sector building output was on a distinct decline throughout the year.
| Chart
8: Main
components of domestic demand (year-on-year rate of change in real terms) |
|
 |
|
| Local consumer spending revived
steadily over the course of 1999. Yet investment spending stayed weak, amidst the relatively high real interest cost and the cautious attitude of the banks towards corporate lending. |
The Labour Market
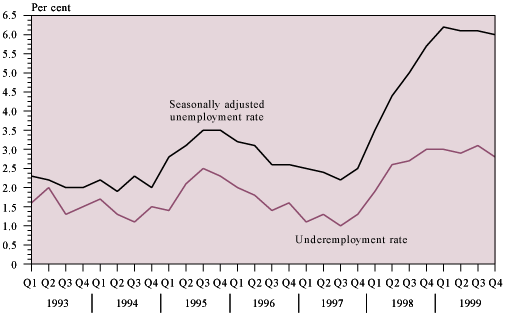
Labour market conditions remained generally slack in 1999, as many companies were still undergoing consolidation and continued to adopt a cautious attitude towards staffing. Yet towards the end of the year, there was a noticeable pick-up in both employment and vacancies, in tandem with the revival in overall economic activity. In line with this development, the seasonally adjusted unemployment rate, having risen from 5.7 per cent in the fourth quarter of 1998 to a peak of 6.3 per cent in March-May 1999, edged down to 6.0 per cent in the fourth quarter. The underemployment rate moved within a fairly narrow range of 2.8-3.1 per cent during the year. In the fourth quarter of 1999, it stood at 2.8 per cent, down from 3.0 per cent in the fourth quarter of 1998.
| Chart 9: Unemployment and underemployment rates | |
 |
|
| Overall labour market conditions
stayed generally slack during the first half of 1999, before showing a modest improvement later in the year. |
For all persons employed, the median hours of work per week lengthened appreciably, from 45 in the fourth quarter of 1998 to 48 in the fourth quarter of 1999. Meanwhile, the proportion of employed persons working for 50 hours or more per week also rose visibly, from 26.0 per cent to 32.6 per cent. There was thus a greater utilisation of the workforce still in employment.
Of particular note was the progressive improvement in manpower resource balance during 1999. On labour supply, the total labour force, though still on an uptrend, underwent some moderation in growth, mainly due to a reduced net inflow of population. As to labour demand, both total employment and total vacancies went up noticeably in the latter part of the year, upon the pick-up in overall economic activity. The narrowing differential between these two growth rates, in contrast to the situation earlier when the labour force grew much faster than employment, should contribute to a further decline in the unemployment rate in due course.
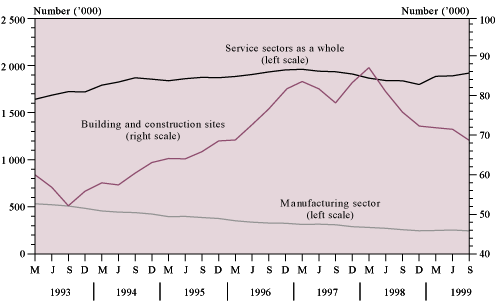
Employment as enumerated from business establishments picked up noticeably. Taking all the service sectors surveyed together, employment leaped by 4 per cent in September 1999 over a year earlier. This was up from the 3 per cent increase in June 1999, and even more so from the 5 per cent decline in 1998. Within the various major service sectors, employment in the retail trade and in restaurants and hotels rose by 8 per cent and 3 per cent respectively in September 1999 over a year earlier, underpinned by the recovery in local consumer spending and further growth in inbound tourism. Employment in the wholesale and import/export trades and in water transport, air transport and services allied to transport also went up, by 5 per cent and 2 per cent respectively, along with the revival in external trade. Employment in storage and communications bounced back to a 7 per cent rise, amidst the rapid expansion in mobile telephone and Internet services. Employment in community, social and personal services and in financing, insurance, real estate and business services likewise gained, by 5 per cent and 2 per cent respectively.
In stark contrast, employment in the manufacturing sector continued on a downtrend, falling by 5 per cent in September 1999 over a year earlier. Yet this was considerably smaller than the decreases of 11 per cent in March and 7 per cent in June. An improved performance of domestic exports in the latter part of the year was a major contributory factor. Employment of manual workers at building and construction sites also fell, by 9 per cent in September 1999 over a year earlier. This was again smaller than the corresponding decreases of 17 per cent in March and 12 per cent in June. Within this total, employment at private sector sites shrank by 30 per cent, following the completion of several major office buildings and winding down of some large private residential development projects. This more than offset a further increase of 17 per cent in employment at public sector sites, due to continued busy work under the Public Housing Programme and increased construction activity on the priority railway projects. Nevertheless, taking into account off-site workers and related professional and support staff, employment for the building and construction sector as a whole fell more moderately, by 4 per cent in the third quarter of 1999 over a year earlier, following decreases of 5 per cent and 7 per cent respectively in the first two quarters.
| Chart 10: Employment by broad economic sector | |
 |
|
| Employment in the service sectors
picked up noticeably in the latter part of 1999, while that in the local manufacturing sector and at building and construction sites showed smaller declines. |
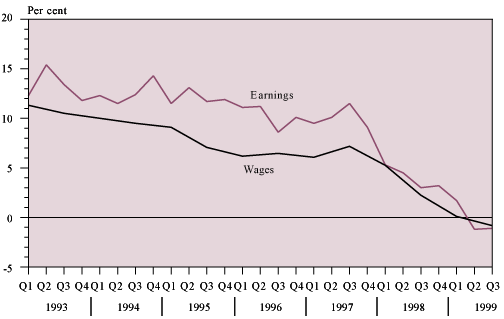
Labour earnings and wages moderated further in money terms in 1999, along with the ongoing cost/price adjustments in the local economy. Overall labour earnings were on average down by 1 per cent in money terms in both the second and third quarters of 1999 over a year earlier. This represented a further easing from the increases of 4 per cent in 1998 and 2 per cent in the first quarter of 1999. Overall wages also fell, on average by 1 per cent in money terms in September 1999 over a year earlier, again moderated from the 4 per cent rise in 1998 and nil change in March 1999. Yet after discounting the effect of a larger decline in consumer prices, both labour earnings and wages showed a fairly significant increase in real terms in the latter part of 1999.
| Chart
11: Earnings and wages (year-on-year rate of change in money terms) |
|
 |
|
| Labour earnings and wages moderated
further in money terms in 1999, along with the ongoing cost/price adjustments in the local economy. |
The Property Market
The market for residential property held stable during the first half of 1999, following a distinct pick-up in late 1998. Almost all the residential flats on sale were acquired by end-users, and speculative interests were minimal. With flat prices being kept down and with a more relaxed and more competitive mortgage lending policy being pursued by the banks, the affordability of home buyers generally improved. The announcement of further fiscal relief measures in March, the favourable response to the land auction in April, and the successive cuts in mortgage rate during April and May provided some additional boost. Yet overall sentiment was still moderate, as potential home buyers continued to be restrained by relatively high unemployment and moderating income. Transactions mostly took place in the primary market for pre-completion flats. In the third quarter, the residential property market quietened to a lower level of trading activity. But towards the end of the year, market sentiment revived somewhat, upon the successful conclusion of China's negotiations with the United States on its accession to the World Trade Organisation, improved overall economic situation, and buoyancy in the local stock market.
Flat prices moved mostly within a narrower range in 1999, after the sharp surge in 1997 and the severe downturn in 1998. During the first five months of 1999, flat prices on average edged up by 4 per cent. This was followed by a decrease of 9 per cent in the period up to November, and then a slight rebound of 1 per cent by the year-end. For 1999 as a whole, flat prices had a net fall of 5 per cent. As to flat rentals, they remained on an easing trend, falling by an average of 3 per cent during 1999. Compared with the respective peaks in the third quarter of 1997, flat prices and rentals in the fourth quarter of 1999 were both substantially lower, by 46 per cent and 30 per cent respectively.
On commercial property, the sales market for office space remained subdued for most of 1999, amidst an abundant supply relative to demand. Also relevant was the generally stringent mortgage lending policy being maintained by the banks for such property. Yet towards the year-end, there was an apparent pick-up in trading activity, reportedly due to acquisition of office space by some overseas investors. In the leasing market, office rentals declined for most of 1999, but the downtrend seemed to have been arrested by the year-end. For 1999 as a whole, prices for office space fell by 13 per cent, and rentals for office space by 19 per cent. Against their peak levels in 1997, prices and rentals for office space in the fourth quarter of 1999 were both sharply down, by 58 per cent and 40 per cent respectively.
On shopping space, the leasing market was broadly stable in 1999. End-user demand improved gradually over the course of the year, upon a steady pick-up in retail business. Yet the sales market for shopping space remained quiet, as investors generally stayed on the sideline in face of an ample supply. For 1999 as a whole, prices and rentals for shopping space fell by 13 per cent and 5 per cent respectively. Against their peak levels in the third quarter of 1997, prices and rentals for shopping space were markedly reduced in the fourth quarter of 1999, by 54 per cent and 19 per cent respectively.
The market for industrial property was sluggish throughout 1999, amidst the continued relocation of production processes outside the SAR. Yet reportedly, the end-user demand for modern multi-purpose industrial premises resurrected somewhat in the latter part of the year, in tandem with the pick-up in export trade. Also partly contributing was an increased take-up of such premises for start-up of hi-tech activities. For 1999 as a whole, prices and rentals for industrial property fell on average by 18 per cent and 10 per cent respectively. Against their peak levels in 1994, the respective prices and rentals were lowered considerably, by 59 per cent and 36 per cent.
Planned developments of property recovered to a 2 per cent increase in 1999, from a 28 per cent decline in 1998. Within this total, planned developments of both residential property and industrial property increased, while those of commercial property decreased.
Consumer prices
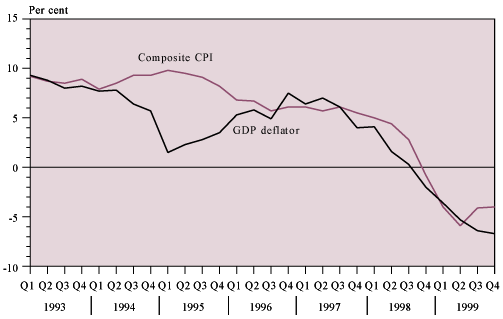
Consumer prices showed a distinct easing in 1999, as the downward adjustment in costs and prices in the local economy continued. Retail prices for a wide range of consumer goods and services exhibited a larger decrease, reflecting the substantial price discounts and other inducements offered by retailers amidst keen competition in the retail market. Consumers had also become more price sensitive. At the same time, there was a continued freeze in government fees and in a number of public utility charges, while a 50 per cent cut in the rates payable was granted for the third quarter. Meanwhile, inflation in the major supplier economies remained low or even negative. This helped to keep the prices of retained imports down in overall terms for most of the year. Yet as the prices of some major commodities in the world market took a visible upturn in the latter part of the year, the prices of retained imports rebounded towards the year-end.
On a year-on-year comparison, the decrease in the Composite Consumer Price Index was enlarged from 1.8 per cent in the first quarter of 1999 to 4.0 per cent in the second quarter, and further to 5.9 per cent in the third quarter. In the fourth quarter, the decrease narrowed back to 4.1 per cent, due in part to dissipation of the effect of a 50 per cent cut in the rates payable for the third quarter, and in part to a low base of comparison a year earlier. For 1999 as a whole, the Composite CPI was down by 4.0 per cent, in contrast to a rise of 2.8 per cent in 1998. This was the first annual decrease recorded since the data series reflecting inflation was available in 1982.
The three sub-indices, namely the CPI(A), CPI(B) and CPI(C) (previously known as the Hang Seng CPI), exhibited a similar pattern of movement. Their respective year-on-year declines widened from 1.5 per cent, 2.4 per cent and 1.2 per cent in the first quarter of 1999 to 3.5 per cent, 4.7 per cent and 3.5 per cent in the second quarter, and further to 5.0 per cent, 6.7 per cent and 5.8 per cent in the third quarter. In the fourth quarter of 1999, these decreases also tapered, to 3.0 per cent, 5.0 per cent and 4.2 per cent. For 1999 as a whole, the CPI(A), CPI(B) and CPI(C) fell by 3.3 per cent, 4.7 per cent and 3.7 per cent respectively, as compared to the increases of 2.6 per cent, 2.8 per cent and 3.2 per cent in 1998.
The GDP deflator, as a broad measure of overall inflation in the economy, fell by 5.6 per cent in 1999. This contrasted with an increase of 0.9 per cent in 1998. Within it, the domestic demand deflator eased by 2.2 per cent in 1999, following a 1.0 per cent rise in 1998. The price deflators for private and government consumption expenditures both declined. Also, the price deflators for exports of goods and services went down further.
| Chart
12: Main inflation indicators (year-on-year rate of change) |
|
 |
|
| Prices eased distinctly further during the course of 1999. |